
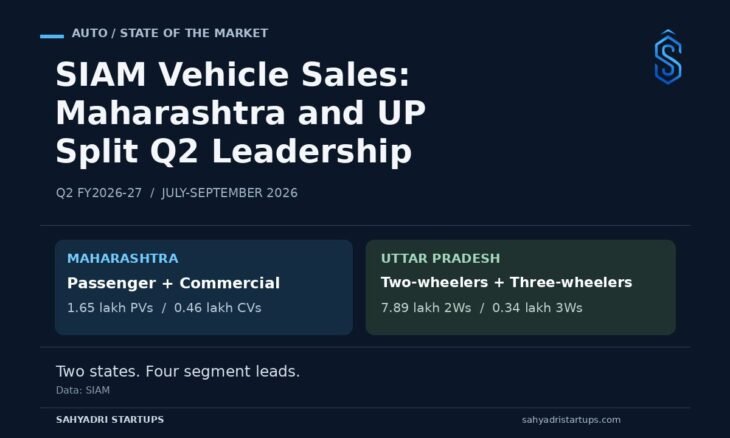
New Delhi: SIAM vehicle sales data for July-September 2026 shows a two-state split at the top: Maharashtra led passenger and commercial vehicles, while Uttar Pradesh ranked first in two-wheelers and three-wheelers.
The Society of Indian Automobile Manufacturers (SIAM) reported national sales of 13.61 lakh passenger vehicles, 64.33 lakh two-wheelers, 2.85 lakh three-wheelers and 3.09 lakh commercial vehicles in the second quarter of FY2026-27.
SIAM Vehicle Sales: Maharashtra Leads Passenger and Commercial Vehicles
Maharashtra recorded 1.65 lakh passenger vehicle sales, accounting for 12.1% of the national segment. Uttar Pradesh followed with a 9.8% share, ahead of Gujarat (8.3%), Tamil Nadu (7.7%) and Karnataka (7.2%). The Western Zone led passenger vehicle sales with 4.29 lakh units.
Maharashtra also topped commercial vehicles with 0.46 lakh units and a 15.0% share. Tamil Nadu (9.2%), Gujarat (9.0%), Uttar Pradesh (7.7%) and Karnataka (7.7%) followed in the order listed by SIAM. The Western Zone led with 1.13 lakh commercial vehicles.
Uttar Pradesh Tops Two-Wheelers and Three-Wheelers
The SIAM vehicle sales release puts Uttar Pradesh first in two-wheelers at 7.89 lakh units, or 12.3% of national sales. Maharashtra followed at 11.1%, then Tamil Nadu (8.8%), Gujarat (7.7%) and Karnataka (6.5%). The Western Zone led two-wheelers with 21.13 lakh units.
Uttar Pradesh also led three-wheelers with 0.34 lakh units and a 12.1% share, followed by Gujarat (10.3%), Karnataka (8.8%), Bihar (8.3%) and Tamil Nadu (6.4%). Unlike the other three segments, three-wheelers were led by the Southern Zone, with 0.96 lakh units.
SIAM Vehicle Sales: State and UT Market Shares
| State / UT | Passenger vehicles (%) | Two-wheelers (%) | Three-wheelers (%) | Commercial vehicles (%) |
|---|---|---|---|---|
| Andhra Pradesh | 2.7 | 4.1 | 6.2 | 3.8 |
| Assam | – | – | 5.8 | – |
| Bihar | 2.1 | 4.9 | 8.3 | 2.2 |
| Delhi | 4.8 | – | 2.4 | 3.5 |
| Gujarat | 8.3 | 7.7 | 10.3 | 9.0 |
| Haryana | 6.2 | 3.2 | – | 6.3 |
| Jharkhand | – | – | 2.6 | – |
| Karnataka | 7.2 | 6.5 | 8.8 | 7.7 |
| Kerala | 7.0 | 3.5 | 6.0 | 3.7 |
| Madhya Pradesh | 3.8 | 5.6 | 4.4 | 3.9 |
| Maharashtra | 12.1 | 11.1 | 4.4 | 15.0 |
| Odisha | – | 3.3 | 2.9 | 2.8 |
| Punjab | 3.5 | 3.4 | – | – |
| Rajasthan | 5.3 | 6.0 | 4.1 | 6.5 |
| Tamil Nadu | 7.7 | 8.8 | 6.4 | 9.2 |
| Telangana | 3.8 | 3.5 | 6.0 | 3.3 |
| Uttar Pradesh | 9.8 | 12.3 | 12.1 | 7.7 |
| West Bengal | 2.8 | 4.4 | – | 3.5 |
| Others | 13.0 | 11.6 | 9.3 | 12.0 |
How to read the quarterly figures
SIAM vehicle sales figures in the state/UT release are rounded to lakh units, and chart shares are rounded to one decimal place. They should not be treated as exact unit counts or used to infer growth without comparable earlier-period data.
SIAM‘s separate national quarterly release reports exact domestic sales of 13,60,687 passenger vehicles, 64,32,842 two-wheelers, 2,85,342 three-wheelers and 3,09,063 commercial vehicles.
Its passenger vehicle figures exclude BMW, Mercedes, JLR and Volvo Auto; commercial vehicle figures exclude Daimler.